
An apartment can appear to become more expensive even when its price per square metre has not moved. If a listing changes from 50 to 52 square metres while its unit rate stays at $1,500, the displayed total rises from $75,000 to $78,000, or 4%. This is an arithmetic illustration, not a measured increase for any Batumi home. The alternative explanations include revised measurements, corrected catalogue records, a different unit configuration or a genuine commercial change. Without documentation, a researcher cannot select one explanation.
In homeradar.ge’s 11 and 28 October 2026 observations, 502 records in the Pontus Rotana Resort & Spa Gonio catalogue showed a different stated floor area. Of these, 105 also showed a different listed total price. These are changes to published fields, not proof that the physical floor areas were altered or that buyers signed amended contracts. The underlying observations do not determine whether the figures reflect survey revisions, data cleaning or redesigned apartments.
A broader count found 503 numerical price changes, including 415 increases and 88 decreases, but that pool mixes records with changing areas and availability statuses. A narrower matched-unit comparison retained 2,311 pairs with the same apartment identity, area, dollar currency and available status on both dates. These are distinct denominators; 105 should not be added to 503 or assumed to be a subset of the 2,311 clean comparisons. Mixing them would generate a false narrative about citywide price inflation.
The distinction is visible in other cases. Nine of 127 comparable Tonino Lamborghini Tower entries differed by only one US cent, a signal consistent with rounding or technical maintenance rather than a material repricing. A newly filled apartment number can improve catalogue completeness without adding a new home to supply. Even price changes in truly matched units reveal asking-price adjustments, not the amounts agreed in signed property contracts.
Georgia’s official Geostat methodology illustrates why quality control matters: its residential property price index uses advertised microdata, removes duplicates and outliers, and adjusts for dwelling characteristics with a hedonic model. Crucially, that official index covers new homes in Tbilisi, not Batumi. It must not be misrepresented as an official Batumi index or treated as transaction-price evidence. A buyer should compare unit numbers, floor plans, contract areas, finishes and written final quotes; registered rights are checked separately through the public registry.
The underlying October catalogue observations and their limitations are described in HomeRadar’s apartment-price methodology analysis. This work illustrates data quality rather than verified transactions.
Sources and limits

HomeRadar — Why Apartment Prices Change in Batumi New Builds ↗
Original two-snapshot listing research; latest observation date · 2026-10-28
HomeRadar — Comparable asking prices at Gate by Artex and Strada ↗
Original matched-listing research; latest observation date · 2026-10-28

National Statistics Office of Georgia — Residential Property Price Index Technical Manual ↗
Official methodology approval date · 2021-04-26

National Agency of Public Registry — Real Estate Registry ↗
Official registry service; access date · 2026-11-03
This is research, not investment, tax or legal advice. Definitions and observation dates remain attached to every claim.
 Poland · Poland unveils public housing investment map as ministry reports PLN 7.1bn in support
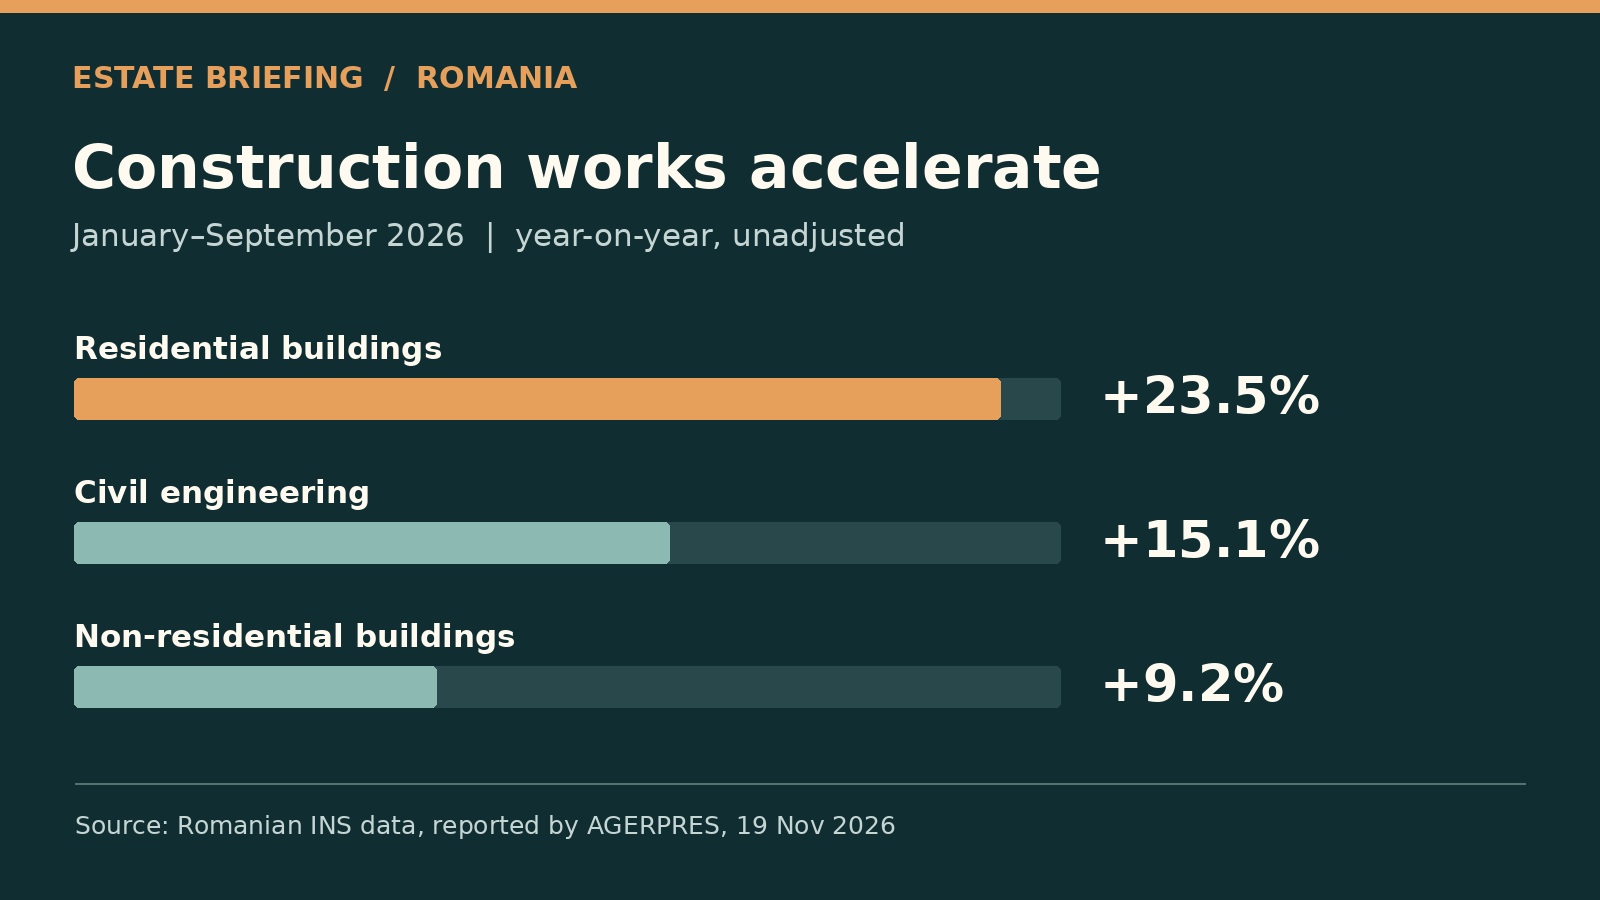 Romania · Romanian residential construction rises 23.5% in nine months
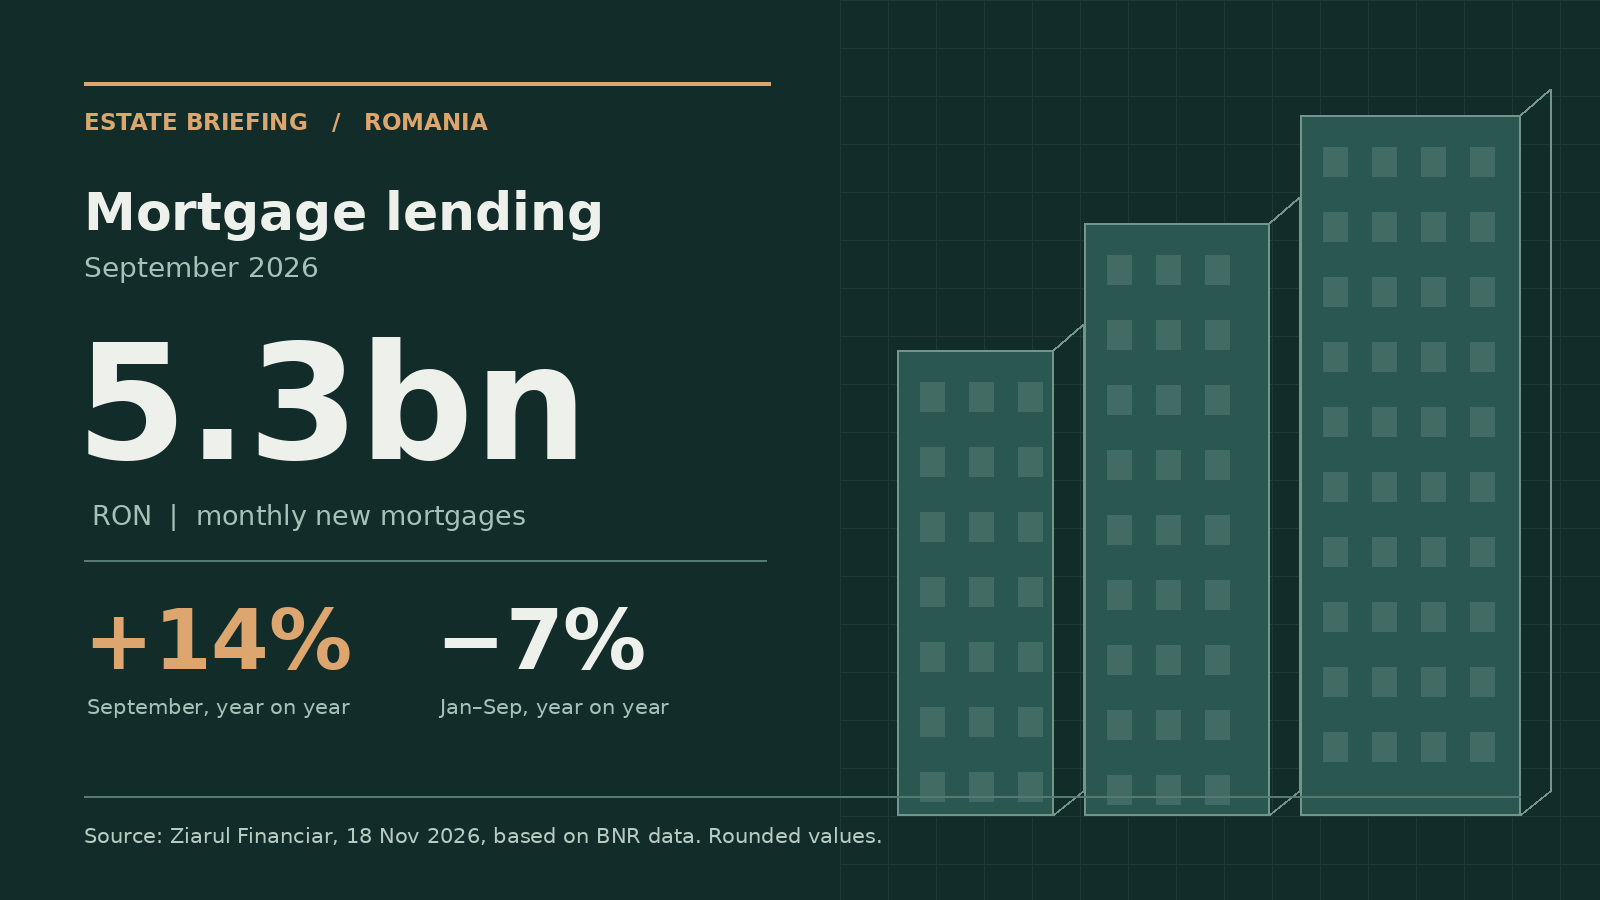 Romania · Romania’s September mortgage lending reaches a record